Communication professionals often struggle to measure the effectiveness of their efforts. Without metrics, it’s unclear whether messages are read and understood, what the sentiment in the organization is, and what employees think, know, and experience. Additionally, reporting to management becomes a challenge without reliable information. Our Statistics feature solves all of this by providing comprehensive insights into every aspect of employee communication.
Track communication effectiveness
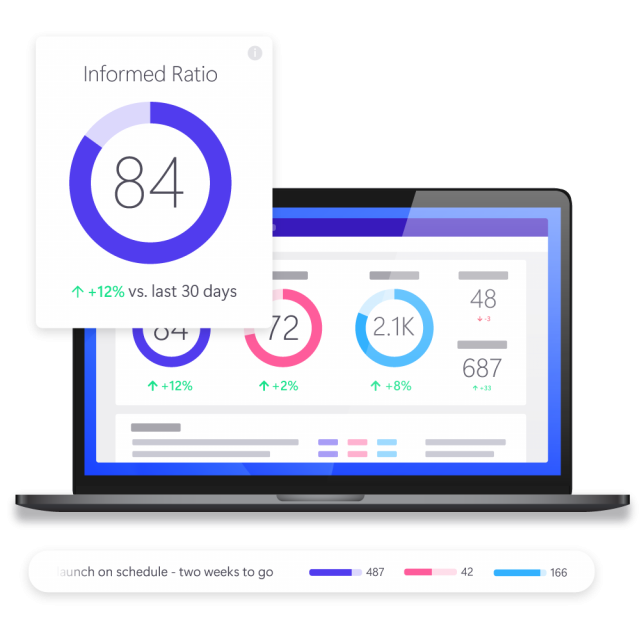
Our Statistics feature provides comprehensive insights into the effectiveness of employee communication. By tracking impressions and reach, you can see how many employees view content across different channels and target groups. Engagement statistics reveal how employees interact through clicks, reactions, and poll participation, while read confirmations and knowledge tracking ensure important messages are acknowledged and awareness levels remain on target. Last but not least, management and HR can effortlessly gain valuable insights to enhance communication strategies.
Monitor reach and impressions
Our statistics feature enables to monitor reach and impressions in multiple ways. With omnichannel analytics, you gain a clear view of readership across all platforms, including TV, PC, and mobile. Additionally, detailed insights by department and content piece reveal how many employees have read specific messages and which ones have gone unnoticed. With these data, you can refine communication strategies – enhancing high-performing channels and messages while changing others to maximize reach and impact.
Measure engagement in multiple ways
Engagement statistics offer a clear view of employee interaction and sentiment. Tracking likes, comments, acknowledgments, and call-to-action (CTA) clicks helps measure participation and responsiveness. Sentiment analysis through pulse polls reveals how employees feel, while poll statistics provide insights into their opinions on specific topics. These insights enable to identify trends, understand workplace dynamics, and take actionable steps to boost engagement.
Request demo
Discover the power of our platform. We would love to show you everything Netpresenter has to offer during a personalized demo.
Enhance knowledge and compliance
Employee understanding of important information and messages is important for any organization. Netpresenter Smart Campaigns provide valuable insights into knowledge levels on various (compliance) topics and automatically adjust training until goals are met. At the same time, employees can acknowledge important updates, offering clear visibility into who has seen and understood a certain message. By leveraging these insights, organizations can improve overall knowledge levels and boost compliance across the workforce.
Convert data into insights
Statistics provide a clear understanding of reach, engagement levels, sentiment, and more. By analyzing these data, communicators can identify trends and patterns, refine strategies, and drive meaningful progress. Comparing before-and-after metrics highlights the impact of communication efforts, making it easier to track improvements. Combined with user-friendly dashboards, these insights make reporting to management seamless and efficient.
Statistics
in a nutshell
Some of our valued customers


Netpresenter blog
Improve your employee communication with Netpresenter statistics
If you want to make an impact with your employee communication, it’s essential to keep track of your messages’ performance. What is working and what isn’t, how can you further optimize your messages, do people click on buttons for additional information, and what devices do people prefer to use? Our platform keeps track of all kinds of interesting statistics to give you answers to those questions.
A Trusted Pioneer in
Employee Communications
For decades, Netpresenter has been pioneering employee communications. Organizations worldwide trust our award-winning platform.


Some questions
already answered
Looking for more information? We’ve collected answers to the most frequently asked questions below. If your question is not listed, feel free to reach out – we’re happy to help!
Can I analyse statistics per screen or device?
Yes, you can filter statistics for individual screens or devices and track unique impressions, such as how many times a slide is displayed on a TV, PC, or seen by a user. The platform also provides an audience breakdown by PC, TV, and users, giving you a detailed view of content reach. Additionally, you can analyse employee interactions, including clicks on buttons and QR code scans, to measure engagement across different devices.
How long is statistical data stored in Netpresenter?
For Articles and Slides, statistical data is stored for 365 days, allowing you to track engagement and performance over the past year. For Pulse Polls, data storage is unlimited, meaning you can view, and filter results over an extended period without restrictions.
Can I create custom dashboards?
No, it is not possible to create custom dashboards. However, the default dashboard for Articles, Slides, and Smart Campaigns provides a clear overview of key statistics, including views, interactions, engagement trends, and quiz results. Additionally, you can use extended filters to refine data by date range, categories, and various sorting options, allowing for more detailed analysis and insights.
How does the Netpresenter platform define an “interaction”?
An interaction is recorded when an employee actively engages with content. This includes actions such as clicking on a call-to-action, responding to a poll, or reacting to a message in the Employee App with a like, comment, or other engagement.
Is it possible to export data?
Yes, you can export data for further analysis or reporting purposes. Reports can be downloaded as a CSV file, allowing you to work with the data in spreadsheet applications. You can export statistics from Articles and Slides, including raw data on views, interactions, and audience engagement. This makes it easy to create custom reports, track trends over time, and share insights with stakeholders.
Does a Pulse Poll include individual employee responses?
No, Pulse Poll statistics provide aggregated data to ensure privacy and GDPR compliance. However, you can track overall engagement trends and filter results by department or location to analyse how different target audiences interact with the Pulse Poll. For regular Polls, there is an option to disable anonymous voting, allowing you to see who voted and how they responded.