Improve your employee communication with Netpresenter statistics
Estimated reading time: 6 minutes
If you want to make an impact with your employee communication, it’s essential to keep track of your messages’ performance. What is working and what isn’t, how can you further optimize your messages, do people click on buttons for additional information, and what devices do people prefer to use? Our platform keeps track of all kinds of interesting statistics to give you answers to those questions. In this blog, we will show you what is being tracked and how you can use this vital data to make your employee communication even stronger!
- Discover the best times to post
- Optimize content for your employees
- Accurate insight into attention boosters
- Track the pulse of the organization
Discover the best times to post
Our platform’s statistics dashboard gives you a glanceable overview of the communication within your organization. It shows how many televisions and PCs are connected and when those devices are being used. This info will tell the IT department that everything is working as it should. But as flextime becomes more common and people are working from home a lot, this data can also provide important insights to determine the best times to publish a message.
Thanks to our scheduling feature, you don’t even need to be at your computer to publish something at the perfect time. Just prepare your message when it suits you and publish it when it suits your staff! It is the best of both worlds and you can rest assured outdated content will be removed automatically as well.
The dashboard will also show you how many messages are currently active and how many have been published in recent months. That’s important to keep in mind as a publisher when creating new messages. After all, you shouldn’t overload your colleagues with too much information. It’s better to spread your messages throughout the week and repeat important information instead of publishing multiple messages simultaneously. Here’s our recommendation:
- Eight to ten messages concurrently on digital signage.
- Twelve to fifteen messages concurrently on screensavers.
- No more than three messages concurrently on the wallpaper and lock screen.
- A maximum of fifteen messages in the app.
Optimize content for your employees
There are separate dashboards available for every channel. Channels are vital to target your messages to the right employees. The more relevant a message is to the audience, the better they will read it. Organizations can create channels for every department, but also the reception, canteen, or the C-Suite. With the right channels in place, everyone will always receive relevant content, and it will make your statistics more useful. You can now see per office or department how often your employees will read your messages and which devices are preferred in each department.
If one department relies heavily on digital signage, like the production hall, you should take that into account when writing a message. Tv’s are not suited for long pieces of text, as people will have to be able to read it at some distance. It’s important to use short, punchy headlines to deliver your message on tv’s. On cell phones and desktops, on the other hand, you can offer a hyperlink for additional information or an article on SharePoint.
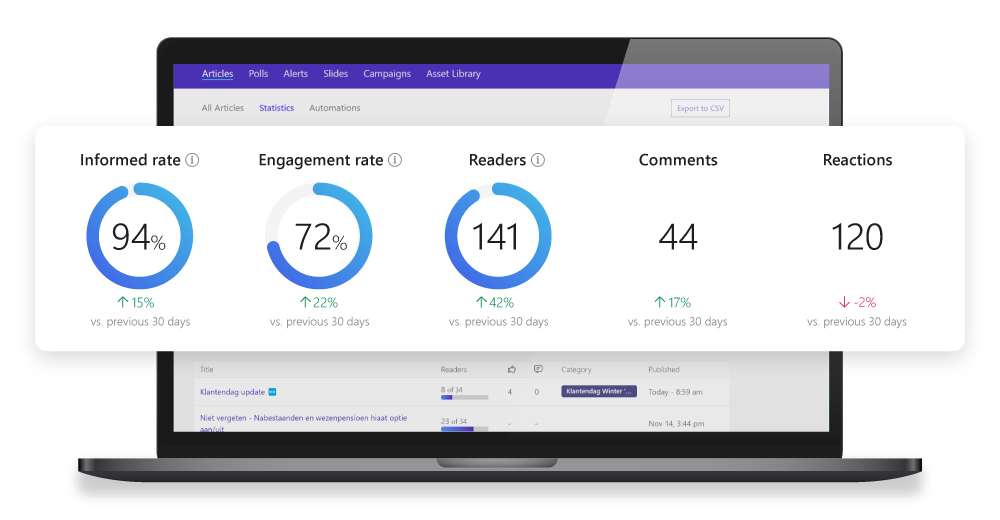
The dashboard also provides insight into which posts get the most engagement. Reactions, likes, click-through rate (CTR); it is all measured, so that you can create better messages time after time. Is a particular message getting a lot of engagement? That’s probably a sign that you are on the right track. Yet a lot of reactions can also be a sign that you need to check if everything is alright. And if you use a lot of hyperlinks without much result, you might want to shake things up a little. Try a more active call to action, such as ‘register now for the training’ or ‘sign up for the afternoon drinks’. Thanks to the statistics, you know immediately if your efforts are paying off.
Accurate insight into attention boosters
Statistics are also a fundamental part of our automated attention boosters. With an attention booster, you create a series of messages automatically published at predetermined times that will run until a set goal is reached. The goal might be that people have read the message, or that employees participated in a poll, or acknowledged that they took a particular action. This feature is primarily used for important messages when you need to make sure people have engaged with it. That’s why it is so important to measure how employees react to your attention boosters.
In the statistics, you’ll find exactly how many employees have reached the set goal. You’ll also see after which message in the campaign your employees reached the goal. The data will tell you how many employees are currently well informed and provide insights for your next attention booster. How many attempts will it take to get your employees to click on a specific link, and what times of day work best? You don’t have to guess, as the statistics will have the answer for you!
Track the pulse of the organization
Extensive statistics are also tracked for Pulse Surveys. Pulse Surveys are designed to receive periodic feedback from employees to measure employee engagement, organizational culture, everyone’s well-being, or other essential topics. That’s why the statistics will show you the vote results and how many employees participated. What’s more, you’ll see how both the results and the number of participants developed over time at a glance.
Yet you don’t need to use a special attention booster or pulse survey for detailed data. Even with a standard message, you’ll be able to see which employees have read the message and who haven’t. The message statistics show the exact date and time people read the message. If you add a button to your message for employees to confirm that they have read it or done something, you’ll also see at what exact time they pressed that button. This way, the content managers within the organization always have insight into how well-informed everyone is.
Want to see our statistics in action? Request a free demo or contact us to see what statistics can do for your communication! Or download the free guide to find the right communication tools to reach your employees.
What is employee communication?
It consists of distributing information across (specific groups of) employees by communication professionals. Its main goal is to help the organization reach its goals through relevant, timely and effective communication. Employee communication is any form of communication between managers of an organization and employees and vice versa. Employee communication can happen electronically via various mediums, such as digital signage, mobile apps, email, the intranet, or collaboration tools. It can also happen verbally.
How to improve employee communication?
Start by defining clear objectives that align with your organization’s goals, ensuring your messaging resonates with various employee segments. Optimize your communication strategy by leveraging diverse channels suited to your workforce’s preferences, such as digital signage, dedicated employee apps, and corporate screensavers, to disseminate information effectively. Carefully craft your content, focusing on clarity, relevance, and engagement, and prioritize establishing robust feedback mechanisms that promote a two-way dialogue, allowing employees to share their insights and feedback, thus fostering a more inclusive and communicative workplace environment.
How long is statistical data stored in Netpresenter?
For Articles and Slides, statistical data is stored for 365 days, allowing you to track engagement and performance over the past year. For Pulse Polls, data storage is unlimited, meaning you can view, and filter results over an extended period without restrictions.
Can I analyse statistics per screen or device?
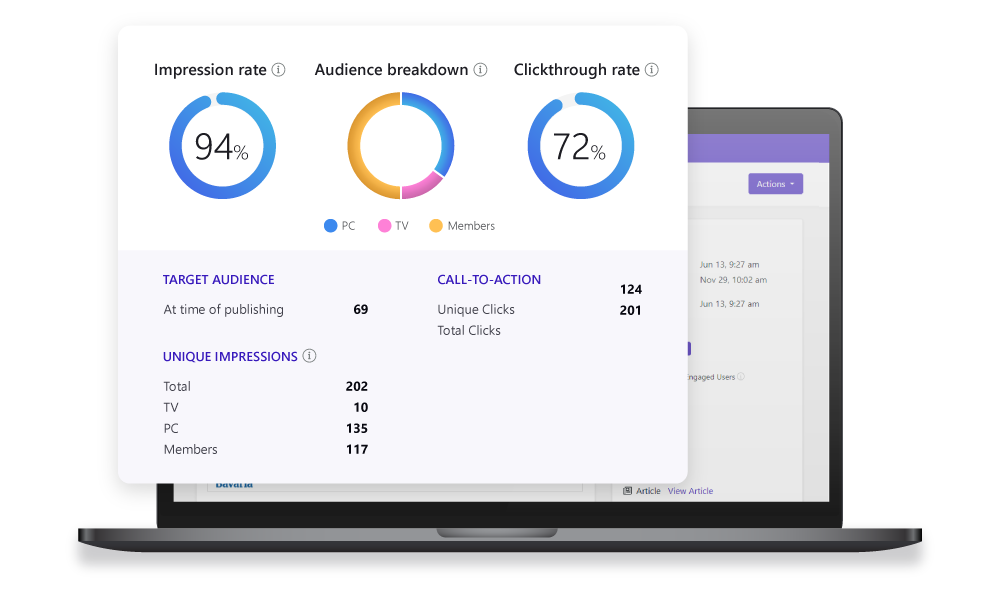
Yes, you can filter statistics for individual screens or devices and track unique impressions, such as how many times a slide is displayed on a TV, PC, or seen by a user. The platform also provides an audience breakdown by PC, TV, and users, giving you a detailed view of content reach. Additionally, you can analyse employee interactions, including clicks on buttons and QR code scans, to measure engagement across different devices.
Why is employee communication important?
Employee communication is important because it can help keep employees informed, engaged, productive, and safe. It can create an open culture, boost engagement and commitment, and increase trust, morale, productivity, and teamwork.
Do I need to schedule a demo to try Netpresenter?
No need to wait for a live demo — just take the self-guided tour at your convenience. It’s quick, clear, and available 24/7.
When should I take a Guided Tour instead of requesting a demo?
A Guided Tour is ideal when:
- You want a quick, on-demand overview without scheduling a meeting.
- You are early in the decision-making process and exploring solutions.
- You want to share an internal preview of the software with colleagues or stakeholders.
Or schedule a personalized free 30-minute demo with one of our consultants to discover the power of our platform. They would love to show you everything Netpresenter has to offer.