Measuring Internal Communication Metrics: Qualitative and Quantitative Data
Estimated reading time: 4 minutes
Measurement matters – especially in internal communications. Measuring your communication effectiveness means you can determine if your communications are making a difference in your business. It can also help you make better communication decisions. Don’t know how to measure your efforts? We’re here to help. In this first blog about measuring internal communication metrics, we show you how to measure internal communication with qualitative and quantitative data.
When you have to convince leadership that internal communications work (and money is well spent), it helps when you have solid numbers. If you can prove the ROI and impact of internal communications, leadership may be more receptive to additional communication efforts in the future. Publishing, increasing your reach, and sharing the right content through the right channel can be optimized with data.
Collect qualitative data
When you start collecting your solid numbers in your internal communications measurement process, it’s wise to look at qualitative and quantitative data. Qualitative data can reveal people’s feelings and opinions about your communication.
A poll or (pulse) survey is a great way to get qualitative data. Surveys offer insights into your colleagues’ preferences. They can be conducted with a platform like Netpresenter, which allows you to send surveys from the same CMS you use to send your internal communication messages. Interviews and focus groups will also provide qualitative data.
Collect quantitative data
Quantitative data is numerical data that can be ranked, categorized, and measured – such as how many employees have read your latest message, have clicked on a hyperlink, or have left a comment on an article. This kind of data answers close-ended questions, such as ‘how many’ or ‘how much’.
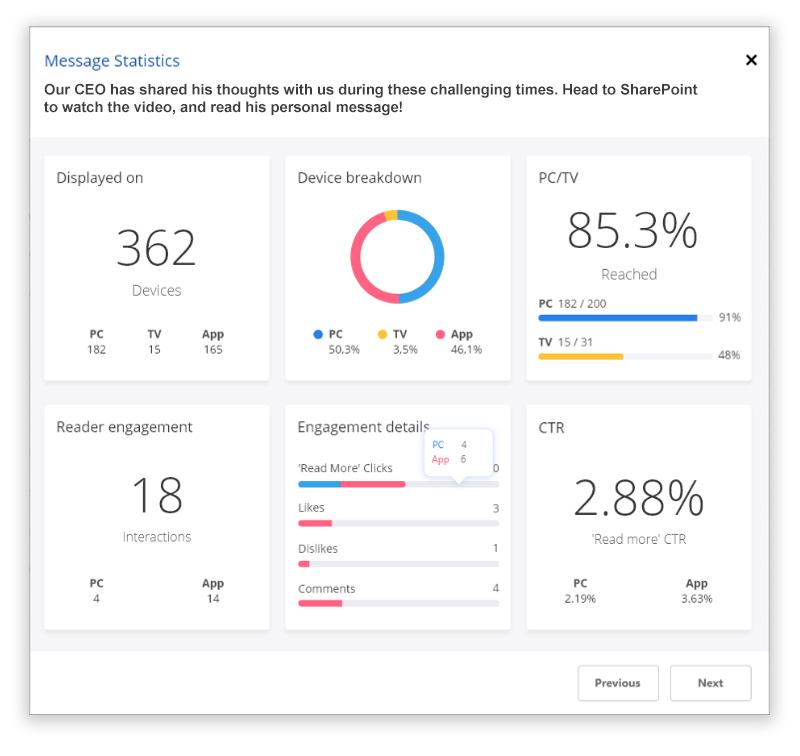
Collecting quantitative data may sound like a cumbersome job. That’s why we’ve designed our statistics feature to provide quantitative data automatically. Our statistics show reach, connectivity details, and click-through rate. You can also track user engagement and discover helpful details such as reads, clicks, likes, and comments.

Our statistics show data for the whole organization, specific channels, or even individual employees over a chosen time period such as a week, a month, or a year.
Better insights with combined data
What someone says on a survey when you’re collecting qualitative data, may not necessarily correspond to their actions. Colleagues might say (in an interview or a survey) that they like to read internal communication messages on Friday afternoon, but statistics show the messages you send out on Monday morning have the highest reach and reads.
This doesn’t mean you should stop publishing messages on a Friday afternoon, but it can help you determine when you can best send out any important messages. Combine your qualitative data with your quantitative data to get the most useful insights for your communication strategy.
What is your IC team’s approach to measuring internal communication metrics? Get in touch with our consultants for advice on measuring your internal communication efforts; they are happy to look into your specific situation and help you get the most out of your internal comms. Would you like to see how Netpresenter statistics can contribute to your internal communication strategy? Schedule a free 30-minute demo to see everything Netpresenter has to offer.

What is an employee communication platform?
An employee communication platform is a software platform that offers organizations several communication tools, unique features, and nifty integrations to communicate with employees wherever they are.
How to measure employee engagement?
Measuring employee engagement typically involves conducting regular surveys that gauge employee satisfaction, commitment, and sense of belonging. Analyzing feedback from performance reviews and one-on-one meetings can also provide insights into engagement levels. Monitoring turnover rates and productivity metrics helps identify areas needing improvement. Open channels for ongoing feedback allow for real-time engagement assessment and adjustments.
How do I measure the effectiveness of Netpresenter Alerts?
Measuring the effectiveness is straightforward thanks to its detailed analytics and reporting features. The platform allows you to track a variety of metrics, such as message delivery status, open rates, and click-through rates. These insights enable you to assess how well they are performing and whether they are reaching and engaging the intended audience. By analyzing this data, you can identify areas for improvement and make necessary adjustments to enhance the impact of your communications. This continuous feedback loop ensures that your messaging remains effective and that your employees stay informed.
I would like to schedule a demo of your platform
Nice! Please fill in this form, and we will contact you within one business day to schedule a demo.
When should I take a Guided Tour instead of requesting a demo?
A Guided Tour is ideal when:
- You want a quick, on-demand overview without scheduling a meeting.
- You are early in the decision-making process and exploring solutions.
- You want to share an internal preview of the software with colleagues or stakeholders.
Or schedule a personalized free 30-minute demo with one of our consultants to discover the power of our platform. They would love to show you everything Netpresenter has to offer.
