How to make a Power BI dashboard on TV with Netpresenter’s integration
Estimated reading time: 4 minutes
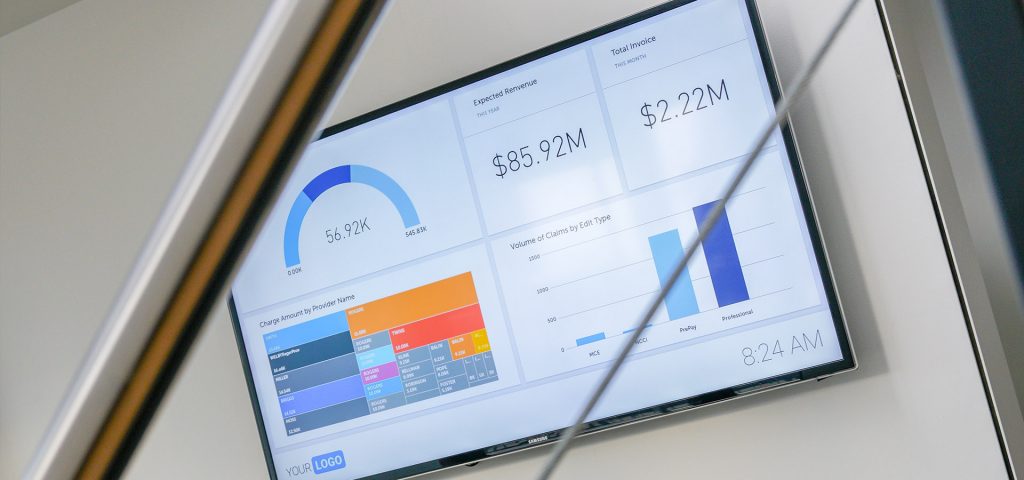
Microsoft Power BI is a great tool for gathering data. But data can only help your organization move forward when it is brought to the right employees. You can provide employees at every level of your organization with key metrics they need to do their job by displaying Power BI dashboards on TV or screensavers. How to make a Power BI dashboard on TV for digital signage? We’re glad you asked! Our customers use our Power BI integration to bring important data automatically to their employees’ attention. Keep reading to see how they do it!
One of the biggest benefits of the integration, according to our customers? It doesn’t require you to keep one individual user logged into an unattended PC linked to a digital signage screen, to display reports and dashboards. Instead, Netpresenter’s Power BI integration automatically extracts data from Power BI and turns these into real-time dashboards that can be displayed directly onto your digital signage and screensavers.
The data can only be extracted from Power BI if Netpresenter first receives an access token to enable the connection to the desired dashboard or report. The integration then takes snapshots of Power BI dashboards and reports of your choice. Parts of a report or dashboard can also be displayed for more detailed data. These snapshots are then published on all digital signage screens in near real-time. However, the dashboards can also be published on specific screens and targeted to certain employees. This way, the data is brought only to those who need it and will remain relevant for everyone!
Power BI data accessible to everyone
Hoenderdaal Fasteners, a Dutch importer and wholesaler in the field of fastening technology, uses Netpresenter Digital Signage to make Power BI data transparent for their staff. Integrations with Power BI provide access to all kinds of data and information that is typically only available to employees with access to a PC. Thanks to the integration, the data is now automatically displayed on digital signage screens throughout the organization’s buildings, allowing Hoenderdaal’s employees to work proactively.
Tristan Hoogmoed, IT support employee at Hoenderdaal Fasteners, explains how Hoenderdaal reaches all of their employees with Power BI data: ‘We use Power BI to zoom in on the details of various processes. We’re now automatically sharing these KPIs with all our departments using Netpresenter. This way, we provide staff with real-time data, so we can anticipate the figures and work proactively. Power BI gives us insight into our business processes. It makes the data visually appealing, making our employees more inclined to look at the important figures and statistics. Our employees now have a good idea of how they and the company are performing – all they have to do is look at the screens. We didn’t have this kind of transparency before.”
Want to learn more about how to make a Power BI dashboard on TV? Find out more about our Power BI integration here or get in touch with our consultants to see the integration in action. Have you gotten interested in everything Netpresenter has to offer? Schedule a free 30-minute demo to see what we can do for your organization. Or download the free infographic why you should display power bi data on tv screens.

How to show a Power BI dashboard on TV?
You can provide employees at every level of your organization with key metrics they need to do their job by displaying Power BI dashboards on TV or screensavers. Our customers use our Power BI integration to bring important data automatically to their employees’ attention. Read more about it in our blog.
Why You Should Display Power BI Data on TV Screens
Power BI makes bringing your data together in one place incredibly easy. However, while Power BI is great for drilling down and slicing data to better represent relations, key metrics, and hierarchies, employees must actually have access to the data and see them on a regular basis to benefit from them in their daily work. This is one of the reasons why you should display Power BI data on TV Screens in your organization. Download our infographic to learn more.
How to share your Microsoft Power BI dashboards with employees
Sharing your metrics with your staff is key to becoming a data-driven organization. Netpresenter can connect your Microsoft Power BI dashboard to display a selection of crucial data on TV and PC screens. This gives your employees valuable insights, right on their own workspace. Read more about it in our blog.
Where can I see a live example of this feature?
Our Guided Tours allow you to experience this feature in a simulated environment. You’ll see exactly how it looks and works for your employees. Or schedule a personalized free 30-minute demo with one of our consultants to discover the power of our platform. They would love to show you everything Netpresenter has to offer.