How to transform ‘Big Data’ into ‘Big Wisdom’
Estimated reading time: 4 minutes
A few years ago, ‘Big Data’ was the talk of the town. Data-driven strategies promised to streamline the organization. From marketing to R&D, every department should be able to work more efficiently by using big data. Some companies have since successfully established a data science team, while others have abandoned the ship. For many, working data-driven proved quite a challenge. Because the method is ‘new’ (and any organizational change encounters at least some resistance), and because the process goes way beyond just collecting data. Companies shouldn’t just pursue Big Data, they should pursue Big Wisdom.
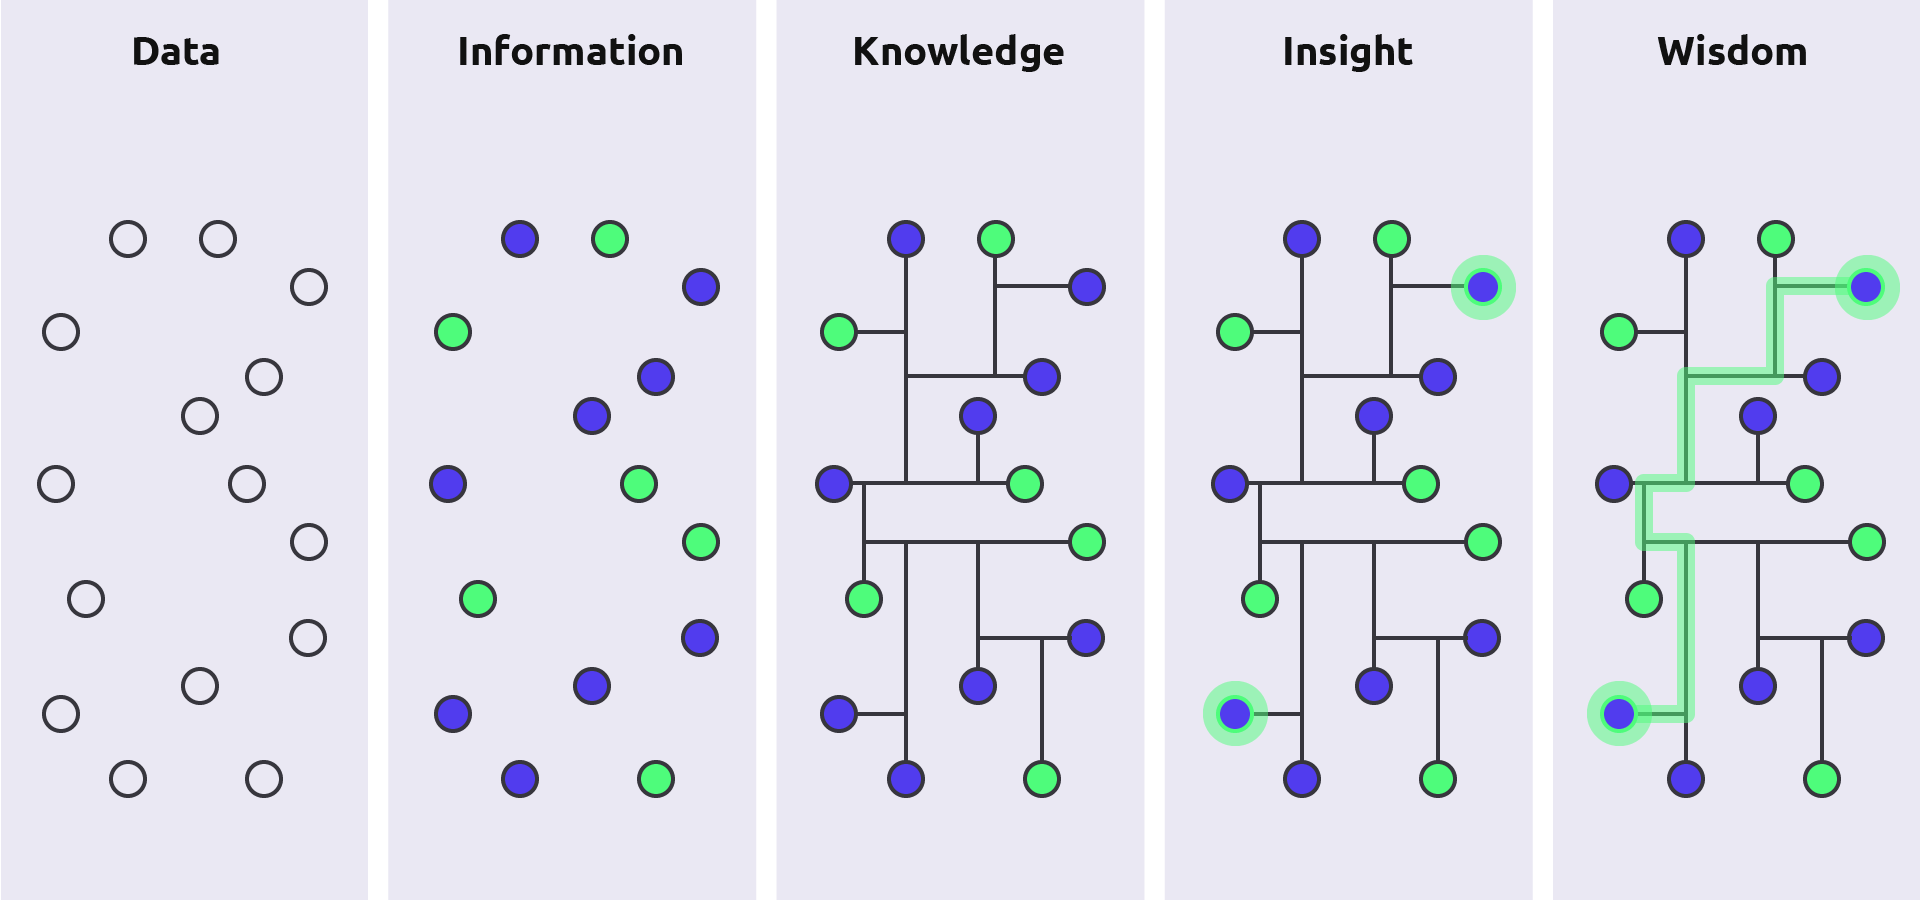
Anyone can deploy Microsoft Power BI or Google Data Studio and add data to it. But that data is not going to let the organization thrive by itself. Unused data turns into so-called ‘dark data’. The data is collected or even stored but does not contribute to anything. A dashboard nobody ever looks at is an untapped goldmine, full of opportunities. To make this data valuable, you must first interpret the data with care. Any bad or contaminated data must be filtered out, while the useful data must be qualified. You need to transform the data into information.
Creating wisdom
But even after turning the data into information, you’re not there yet. After all, if all that information remains a well-kept secret, it will not do much for the organization. People need to have access to that information apply it in their work. The more, the merrier. From office employees till factory workers. After all, you want this information to be translated into knowledge and insights. When they use that knowledge and those insights to come to better decisions in their daily work, the data is finally converted into wisdom.

This process to transform data into wisdom is often described as the DIKW hierarchy or pyramid. This widespread information science model has been around since the 1980s, although it is unclear who first described the concept. There are also many variations. Sometimes it is described as a pyramid, sometimes as a chain. Additional steps are also often added to the model. While there are many variations to the DIKW-concept, everyone agrees collecting data is just a means to an end: to achieve wisdom.
Power BI dashboards on narrowcasting screens
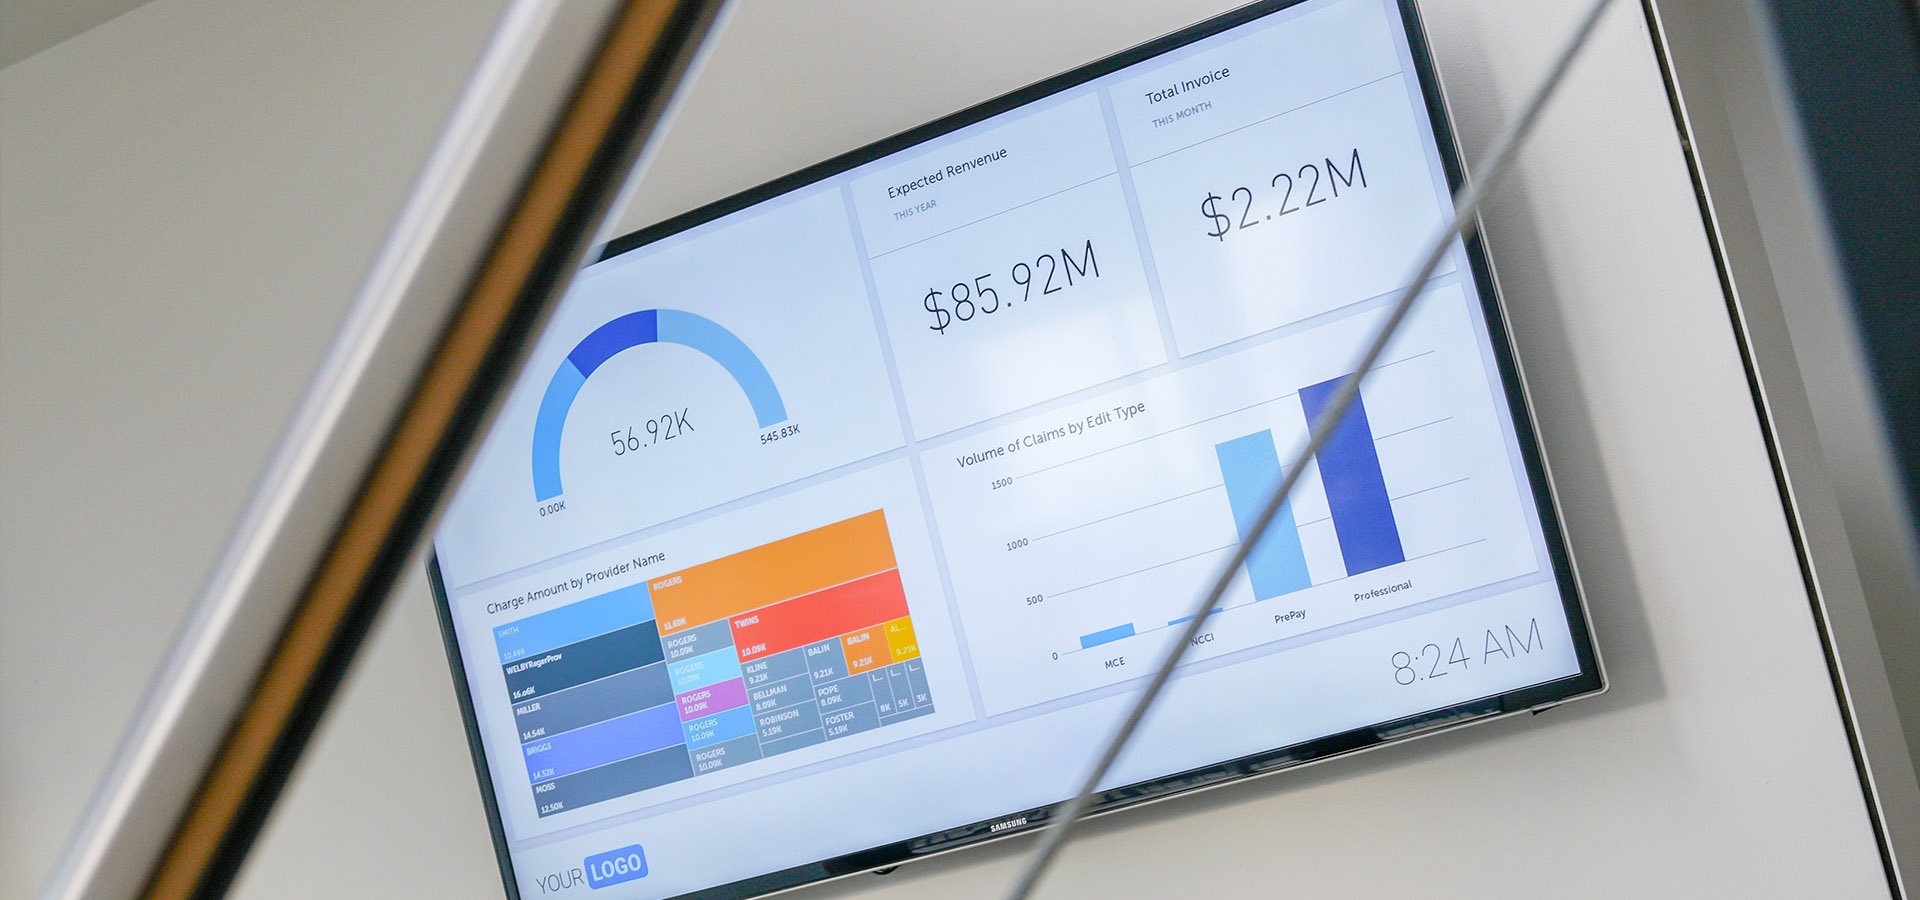
To become a truly data-driven organization, you need to find a way to make your data accessible for your employees. Dutch company Hoenderdaal Fasteners faced the same challenge. The company uses Microsoft’s Power BI to zoom in on the details of various processes and keep track of their KPIs. They chose digital signage as a solution to make the data from Power BI more accessible and transparent.
Data from their Warehouse Management System (WMS), Enterprise Resource Planning system (ERP), and Excel all come together in Power BI. The Power BI dashboards are then displayed visually attractively on the digital signage screens, giving the departments instant insight into the daily processes.

Thanks to a direct link, Power BI data is displayed in real-time, allowing employees to anticipate the figures and work proactively. Now all employees can see how they and the company perform, just by looking at the screens. The solution even saves time, as employees no longer have to search for the information themselves: It is already right in front of them. This is a perfect example of how you turn data into information, transform the information into knowledge, and ultimately create wisdom within the organization.
Do you want to provide your organization with more wisdom? Please contact our consultants, they will be happy to tell you all about it!
